Have you ever noticed the advantage of real n-sphere hypermaps?
No?
That is very sad, because with hypermaps thou would understand, recognize, realize immediately,
that alpine pastures for cattles offer little crop yield for humans;
that mordern technical agricultureof is nearly impossible in hilly and mountainous impassable areas with rocks and small swamps inside and only 2% continuous flat area per hectare.
that cattle breeding in certain climatic alpine mountainous regions has much lower risk as Agricultureof with poor hervests in worse case.
that cattles transforrm & recycle low-calorie vegetarian naural grown food much better than humans or hunter mammals with a short intestine.
that chances of success for cattle and sheep breeding are similarly much higher as profitable modern agriculture at Scottish Highlands in the marsh, around rual areas beside Loch Ness, on Outer Hebrides and on small isles (Inishbofin, Claire Island) near the Irish north-west coast.
A trigger is an impulse that causes people or programmed machines to take certain actions after a message has been understood in both semantic and pragmatic context. Strong triggers include furthermore the feeling of high priority and generate a strong tendency to act, well as an awareness of the consequences of not acting now.
Some examples for triggers
Weather is stormy and rainy (semantically and pragmatically understood) ⇒ → (Trgger) →(T) → ⇒ I have to open my umbrella
Fire breaks out ⇒ → (Trgger) →(T) → ⇒ Trigger fire alarm and call fire department
FED is lowering prime interest rate from 2,25% to 0,5%.⇒ → (Trgger) →(T) → ⇒Let's get a cheap credut (loan) in US$ and make classical leverage invest in Dow Jones & Nasdaq!
Detect hard fact reality vs story telling theater by observing behavior of trigger
When I was in the army long time ago, we learned several emergency commands / orders. One of that was 'AC-Alarm' (Atomic nuclear, biological or chemical are launched, so troops had to immediately Initiate protective suit and emergency measures)
Nobody was ever maling many funny jokes in that training, similiar to fire breaks out ⇒ fire alarm in the examples above. When observing the trigger behavior. everybody recognizes, that this is no playing game and a real dangerous situation. Same story, when people are infected with HIV (AIDS) Virus or (not so deadly) Malaria.
Well, when looking at the Coronavirus, triggers are too soft, negligently, inconsistent.
Remember all Dioxin, Plutonium, Anthrax incidents in the last 25 years, remember even Creutzfeldt–Jakob disease. triggers were much more hard and serious, even when there was never danger for many people in all that cases.
According the media Coronavirus has already killed hundreds of thousands of alleged dead, but nobody's reacting or triggering heavy casualties for real. People are still playing that game, but nobody takes / triggers that Coronavirus real serious / grievous.
Im Jahr 2014 befasste ich mich rein privater Natur mit dem Wachstum / Entwicklung / Überhitzung der veschiedenen Wirtschaftssektoren, Sparten, Branchen, Fachgruppen, Berufsgruppen und sonstige kurzfristingen Trends und langfristiger Entwicklungen in den Bereichen Arbeit und Wirtschaft anhand des ganz konkreten Beispiels der Berufsgruppe Selbstständige Personenbetreuer.
Ich verfasste folgenden sehr kurzen Artikel auf meinem Blog hier dann dazu. Der Grund für gerade diese Berufsgruppe für jene Fallstudie war nicht etwa ein sozialer Hintergrund (z.B. arme ausgebeutete Scheinselbstständige im untersten Einkommenssegement) oder ein rassistisches Motiv (es handelt sich bei Mitgliederinnen dieser Berufsgruppe vornehmlich um weibliche der Volksgruppe der Slawen zugehörige osteuropäische EU-Bürgerinnen), sondern ganz simpel und einfach die Tatsache, dass es in Österreich aufgrund der demographischen Entwicklungen in diesem Marktbereich sehr leicht einschätzen lässt, welche Nachfrage es durch immer mehr pflegebedürftige Pensionistinnen gibt und gleichzeitig welcher Angebotsbedarf an Personenberteuerinnen (Pool an Betreuerinnen) dazu sich korrespondieren entwickelt.
Bis Anfang Jänner 2019 stiegen Angebot und Nachfrage in der Pflegebetreuung relativ konstant an (eine immer größer wachsende Anzahl von Pfelgebedürftigen mit immer exklusiveren Bedürfnissen stand korrelierend ein stetig wachsendes Angebot an Pflegeleistungen und immer mehr Betreuerinnen gegenüber).
Im fortschreitenden Jahr 2019 stagnierte allerdings die Angebotsseite deutlich zum 1. Mal seit Jahren und es gab kein sichtbares signifikantes Wachstum bei der Anzahl der sich anbietenden Personenbetreuerinnen.
Seit Anfang 2020 schrumpfte bereits die Angebotsseite sichbar. (sprich eine signifikante geringere Anzahl an vorhandenen selbstständigen Personenbetreuerinnen offerierte eindeutig nicht mehr derart manngfaltige Liestungsangebote, sondern viel mehr ein günstiges Standard-All-In Paket / Dienstleistung).
Laut Statistik der Wirtschaftskammer Österreich sind die Staatsschulden von Deutschland die letzten Jahre extrem gesunken (von 82% des BIP 2010 auf 56,8% des BIP 2020 approximiert).
Alle unterschiedlichen Quellen bestätigen, dass Deutschland seine Staatsverschuldung in den letzten Jahren im Vergleich zur Wirtschaftsleistung (Brutto-InlandsProdukt) extrem reduzierte.
Ob Deutschland Investitionsbedarf im Bildungs- oder Infrastrukturbereich hat, kann ich nicht beurteilen, ich habe dazu leider keine Quelle.
outdoor & elements [swimming, skating, ice-skating, cycling, climbing, military, horse riding, sports with dogs] please notice, that military, horses and hounds is only a final joke. please take not all 100% seriously, but try to understand the message
Mathematics
Geopolitics & Economics
Mechatronics
Instead of physics, IT and additional electronics, I would try to introduce a much more practical mechatronic light little bit more light weight module already in school by introducing something like Lego mindstorms: Children and young people can so easy learn, how to combine mechanics construction, electronics and IT programming with quick and boombastic results.
Culture & Aesthetics
Ethics
I would dump all religious courses in school and provide instead a mandatory ethic coursed for all children. Basic knowledge part of that course should include most important religions, ideologies (like socialism, democratic and totalitarian ideologies, imperialism, love movement of 68, deep state ethics, feminism and so on). At college level, we might include philosophy here too.
Practial part should help to resolve cultural, gender, religious or any other ideologically based conflicts by playing role plays, visiting conflict areas in country, etc.
Strong religious believers could offer their childs excellent private courses during their free time, if they want. But mission in school is different, religion should be more in private and family / community space than in public education. (There are certain expensive private religious schools too, everyone is free to take that choice).
In year 2017 GDP of Luxembourg amounted to 62,40 billion US$ (62.400.000.000 US$).
In year 2011 GDP of Luxembourg amounted to exactly 62 billion US$ (62.000.000.000 US$).
In year 2017 private sector debt of Luxembourg was 474,84% of GDP
62,4 * 4,4784 = 296,30016 billon US$ (296.300.160.000 US$)
In year 2011 private debt to GDP of Luxembourg was 407,9% of GDP.
62 * 4,079 = 252,898 billion US$ (252.898.000.000 US$)
In year 2017 public sector debt of Luxembourg was 23% of GDP.
62,40 * 0,23 = 14,352 billion US$ (14.352.000.000 US$).
In year 2011 public sector debt of Luxembourg was 18,8% of GDP.
62,40 * 0,188 = 11,7312 billion US$ (11.731.200.000 US$).
So,
in year 2017 public & private sector debt of Luxembourg amounted to 310,65216 billion US$ (310.652.160.000 US$).
In year 2011 public & private sector debt of Luxembourg amounted to 264,6292 billion US$ (264.629.200.000 US$).
In year 2017 population of Luxembourg was 590.000 citizen (habitants).
In year 2011 population of Luxembourg was 510.000 citizen (habitants).
So,
in year 2017 public + private debt per citizen amounted to 526.529,08 US$. (= 468.171,23 €)
In year 2011 public + private debt per citizen amounted to 518.880,78 US$. (= 461.370,63 €)
Private & public sector debt per citizen in Luxembourg amounts approximately to ½ million US$ (constantly between 2010 - 2018)
Quiet a very high amount per citizen, but dear Hans-Werner Sinn, how do you calculated in 2011 1,9 billion € (maybe trillion, cause german word Billionen means english trillion) of public sector + banking debt per citizen in Luxembourg?
Hans Werner Sinn debt calculation differs to tradingeconomics calculation by 380.000%. (That's really quiet a huge difference, in best case, when he meaned trillion it's another factor 1.000 => 380.000.000%)
Debt comparsion with other countries in year 2017
Germany
Germany pub. + priv. 211,5% debt of 3.677,44 billion US$ GDP
7.777,7856 billion US$ = 7.777.785,6 million US$ total debt in Germany.
7.777.785,6 million US$ / 82,52 million citizen = 94.276 US$.
83.827 € total debt per german citizen.
Austria
Austria pub. + priv. 241,6% debt of 416,60 billion US$ GDP
1.006,5056 billion US$ = 1.006.505,6 million US$ total debt in Austria.
1.006.505,6 million US$ / 8,77 million austrian citizen = 115.690,30 US$
102.868 € debt per austrian citizen.
Austria gdp per capita = 49.129,23 US$
Austria gdp per capita ppp = 45.436,69 US$
Austria gdp per citizen = 47.340,90 US$
Austria gdp per gainfully employed (4,2605 million 82,78% in private sector, 17,21% in public sector) = 97.782 US$ (= 86.944,33 €)
Average income of employed in Austria is (45.345€ labor costs for company) 32.267€ before taxes, 22.640€ after taxes per year (2017).
How gdp per capita ppp is calculated? Are only working people included or retired people too?
Japan
Japan pub. + priv. 483% debt of 4.872,14 billion US$ GDP
23.532,4362 billion US$ = 23.532.436,2 million US$ total debt in Japan.
23.532.436,2 million US$ / 126,7 million japanese citizen = 185.734 US$.
20.787.295¥ debt per japanese citizen
United States
United States pub. + priv. 358,4% debt of 19.390,60 billion US$ GDP
69.495,9104 billion US$ = 69.495.910,4 million US$ total debt in United States.
69.495.910,4 million US$ / 325,7 million american citizen = 213.374 US$.
213.374 US$ debt per american citizen
Switzerland
pub. + priv. 296% debt of 678,89 billion US$ GDP
2.009,5144 billion US$ = 2.009.514,4 million US$ total debt in Switzerland.
2.009.514,4 million US$ / 8,5 million swiss citizen = 236.413,46 US$.
236.413,46 US$ debt per swiss citizen
Ireland
Ireland pub. + priv. 450,27% debt of 333,73 billion US$ GDP
1.502,686071 billion US$ = 1.502.686,071 million US$ total debt in Ireland.
1.502.686,071 million US$ / 4,8 million irish citizen = 313.060 US$.
When looking at GDP per capita, we see that GDP calculaton is often a very big bullshit.
According to tradingeconomics an irish citizen yields almost twice the GDP per capita performance of average japanese citizen. Japan is an industrial export country with at huge positive balance of trade and current account, while Ireland's current account is tiny positive cause of tourism and US tech giants IT cloud services (like amazon cloud Ireland or Microsoft IT departments). Prices in Ireland are very high compared to the rest of euro-area. But blowing up GDP, by increasing prices is a very evil GDP magick in my point view (Really, really)! (And yes, high prices in Ireland are one reason for that "greater" GDP per capita, but that's not the only reason of this GDP distortion). On the other side, Germany artificially shrinks his GDP (according to all other macroeconomic indicators of Germany).
Key interest (prime) rates will remain at 0% at least until the end of 2019.
Inflation in the eurozone is expected little less than 2%.
Eurozone has no longer same substantial problems as in 2016, progress has been made.
Economic growth in the eurozone is still weak, and there are still geopolitical and other problems.
Structural reforms in many countries need to be continued. Member states should implement growth-promoting measures. (still a problem, that too few structural reforms and simultaneously avoiding growth friendly steps).
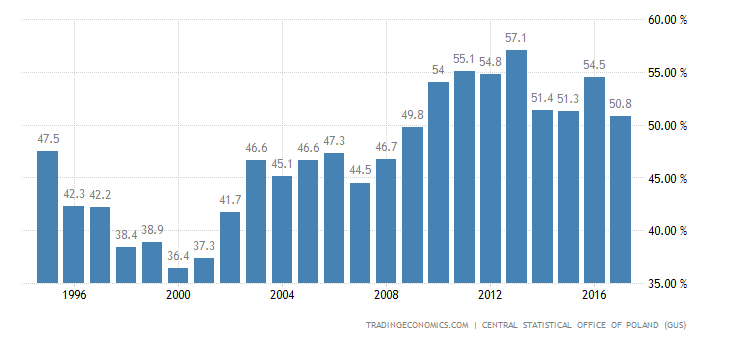
Poland recorded a government debt equivalent to 54.40 percent of the country's Gross Domestic Product in 2016. Government Debt to GDP in Poland averaged 46.47 percent from 1995 until 2016, reaching an all time high of 55.70 percent in 2013 and a record low of 36.50 percent in 2000.
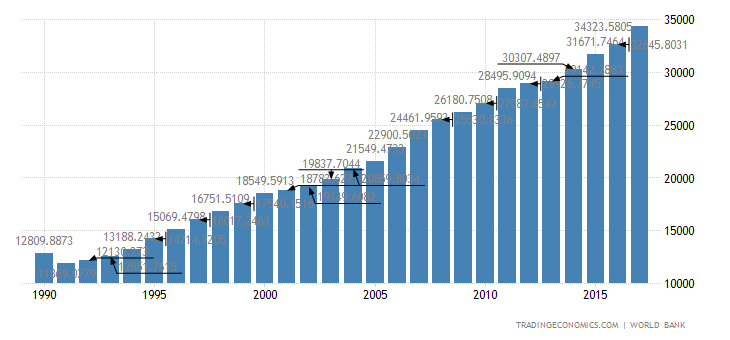
The Gross Domestic Product per capita in Poland was last recorded at 26003.01 US dollars in 2016, when adjusted by purchasing power parity (PPP). The GDP per Capita, in Poland, when adjusted by Purchasing Power Parity is equivalent to 146 percent of the world's average.
Main stock index the Warsaw Stock Exchange WIG is performing very well over the last 4 years, since other european stock indices were in trouble during the same time.
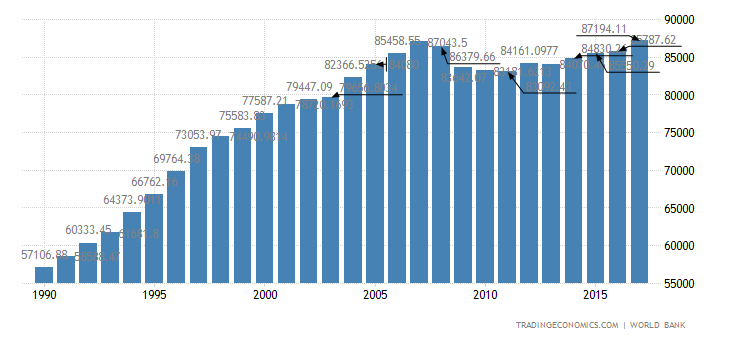
The Gross Domestic Product per capita in Norway was last recorded at 64272.16 US dollars in 2015, when adjusted by purchasing power parity (PPP). The GDP per Capita, in Norway, when adjusted by Purchasing Power Parity is equivalent to 362 percent of the world's average.
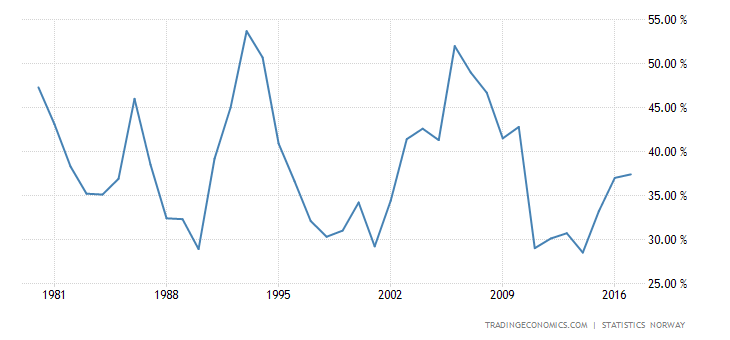
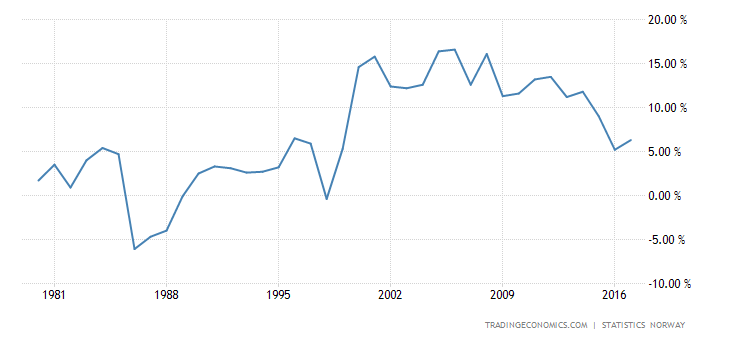
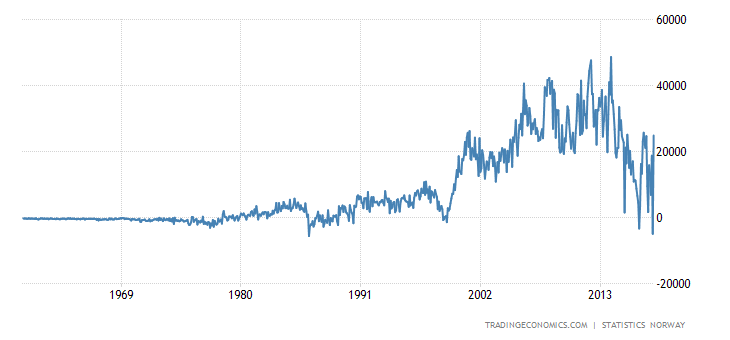
Current Account and Balance of Trade generate quiet good surplus
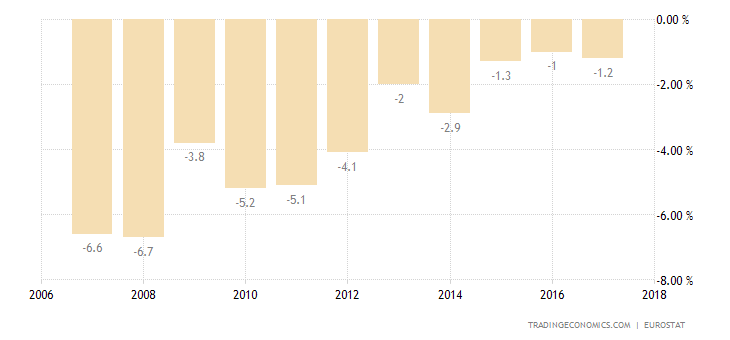
Norway recorded a Current Account surplus of 4.90 percent of the country's Gross Domestic Product in 2016. Current Account to GDP in Norway averaged 6.85 percent from 1980 until 2016, reaching an all time high of 16.20 percent in 2005 and a record low of -6.10 percent in 1986.
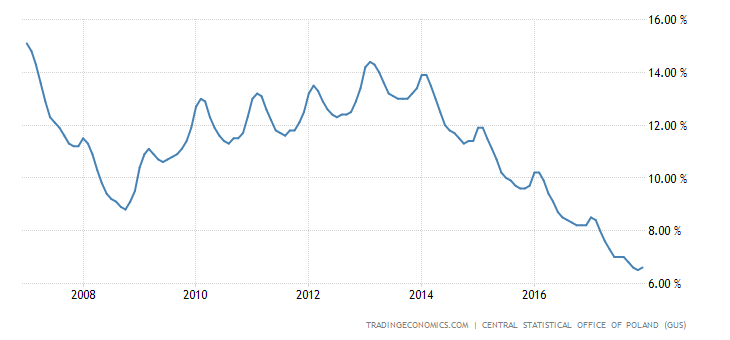
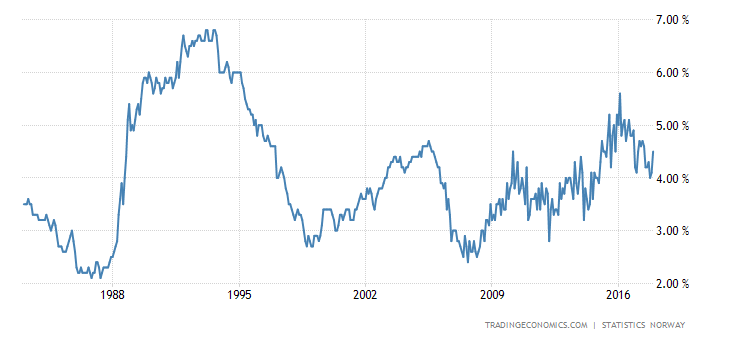
Unemployment rate is as low as US (much lower as euro-zone average with 9.2%)
Norway's seasonally adjusted unemployment rate edged up to 4.6 percent in the three months to May 2017 from 4.3 percent in the December-February period and above market expectations of 4.4 percent.
Main stock index the Oslo Børs All Share Index (OSEAX) is performing very well over the last 4 years, since other european stock indices were in trouble during the same time.
Auch die Demographien (Alterspyramiden) der Vereinigten Staaten, Kanada und Mexiko sehen weitaus gesünder aus, als die der meisten europäischer Staaten. Die Rentensysteme der USA, Kanada und Mexiko stehen auf sehr soliden Beinen und sind sehr nachhaltig gestaltet, nicht nur für Kinder, sondern auch bereits für Enkelkinder.


